Box Plot
My Definition
Key Characteristics
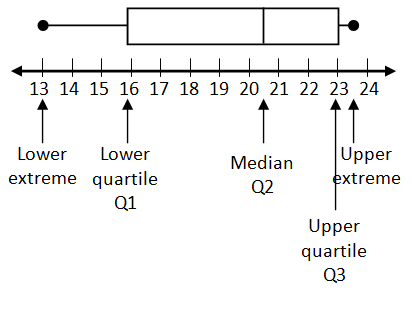
The following are true of a box plot:
- It is also known as a box and whisker plot.
- It divides data into four groups with the same number of elements in each group.
- The "box" represents the middle 50 percent of the data set.
- "Whisker(s)" represent the lower and upper 25 percent of the data set.
- It displays median, upper and lower extremes, quartiles, interquartile range (IQR), and range of data.
- The shape of the box plot is related to the spread (variability) of the data.
- It does not display each element in the data set.
Example
Box Plot InteractiveUse the above link to further study the box plot.
To enter your data into the plotting tool, drag the dot onto the number line. Note that its value is listed below the number line. Once five values have been placed on the number line, the corresponding box plot will appear. Note: only whole number values may be used.
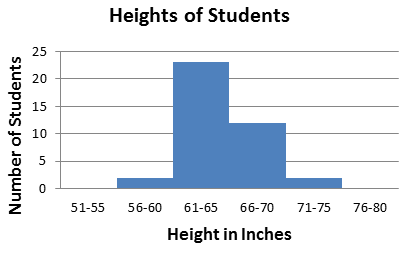
Non-example
Heights of Students is an example of a histogram.