Comparative Dot Plot
My Definition
Key Characteristics
The following are true of a comparative dot plot:
- It is used to compare multiple sets of data.
- It uses separate dot plots for each data set.
- Data describes the same variable in each dot plot.
- It allows comparisons of the mode, range, and outliers between and among multiple data sets.
- The shape of the dot plot may be used to compare the shape, spread, and center of data.
Example
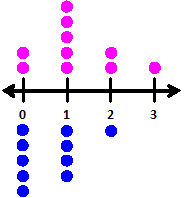
Dog owners were asked the question, "How many pets other than dogs do you have in your home?" The data represented in the blue dot plot are from dog owners.
Cat owners were asked the question, "How many pets other than cats do you have in your home?" The data represented in the pink dot plot are from cat owners.
How are they similar? How are they different? What comparison statements can you make about these two sets of data?
Non-example
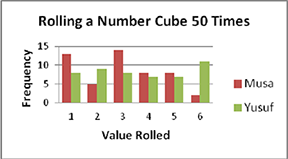
Rolling a Number Cube 50 Times depicts a double bar graph.
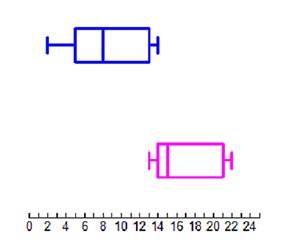
Number of Sit-Ups Completed in 30 Seconds depicts a comparative box plot.
Number of Sit-Ups Completed in 30 Seconds