Histogram
My Definition
Key Characteristics
The following are true of a histogram:
- Data is organized into equal, non-overlapping intervals represented by bars of the same width with no space between the bars.
- The height or length of the bar represents the frequency of occurrences within each interval (frequency distributions).
- Changes in interval size of the continuous data depicted on the x-axis may influence interpretations related to the spread of data.
- Individual data points cannot be determined from a histogram.
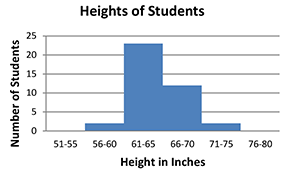
Example
Heights of Students is an example of a histogram.
Explore histograms using this link.
1. Select a data set from the drop down menu.
2. Click on "Show Frequency Table" to see the data values used to create the histogram.
3. Move the slider below the histogram to the left and to the right so change the interval size. What do you notice as the interval size is increased? Decreased?
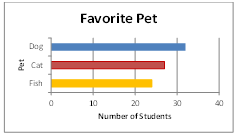
Non-example
Favorite Pet is an example of a bar graph. A bar graph shows countable data grouped into categories.