Pictograph
My Definition
Key Characteristics
The following are true of a pictograph:
- Pictures or symbols are used to represent the frequency of data values in a data set.
- Each picture or symbol may represent one or more of the same data values if noted.
- It allows comparisons between and among quantities to be made.
- It can be a dot plot.
Example


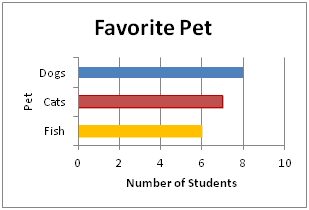
Non-example
Favorite Pet is a bar graph.