Scaled Interval
My Definition
Key Characteristics
The following are true of a scaled interval:
- It is the common length between gridlines as listed upon each axis.
- The common length may be values other than one.
- It allows for accurate graphical representations of data.
- It depends on the range of the data.
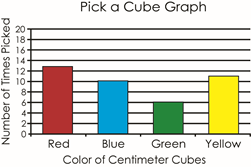
Example
The graph below has a scaled interval of two.
Click on this link. Once there, scroll down to choose a data set and click on 1988 US government spending (in billions). What do you notice about the scaled intervals on the axis labeled Billions of Dollars?
Now, change your maximum value on the bar graph to 2000. What happens to the scaled intervals? Why do you think they change?
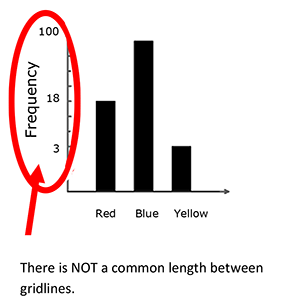
Non-example
Student's Favorite Color