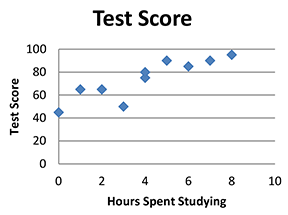
Scatterplot
My Definition
Key Characteristics
The following are true of a scatterplot:
- It is a way to graphically organize a set of bivariate data.
- It plots data as ordered pairs on a coordinate grid.
- It can show the relationship between two sets of data.
- It can show any correlation between the two variables.
Example
Have each student in your class measure his/her height and hand-span and record both measurements. Then, create your own scatterplot with this data at this link. Sample data is included, as well.
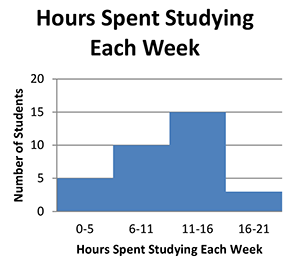
Non-example
Hours Spent Studying Each Week is a histogram.