Stem-and-Leaf Plot
My Definition
Key Characteristics
The following are true of a stem-and-leaf plot:
- Data is displayed using two parts. The separated left column is called the "stem," and the row to the right of the separated column contains the "leaf" or "leaves."
- Every data point is listed, including those that are repeated.
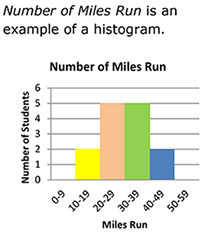
- The length of the line containing the leaves next to a single stem corresponds to the height of the vertical bars on a histogram while allowing individual data points to be known.
Example
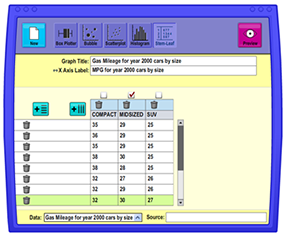
Stem-and-Leaf Plot Interactive
After selecting stem-leaf as the graph type, enter your own data in column one or select "Gas Mileage for year 2000 cars by size" to access the sample data shown below. Click on the image to view the sample data in a larger size.
After selecting stem-leaf as the graph type, enter your own data in column one or select "Gas Mileage for year 2000 cars by size" to access the sample data shown below. Click on the image to view the sample data in a larger size.

Non-example