Bar Graph
My Definition
Key Characteristics
The following are true of a bar graph:
- Bars of the same width are used to represent the frequency of each value in a data set.
- The height or length of the bar represents the frequency of a specific data value.
- Data may be numerical or categorical.
- The graph may be drawn vertically or horizontally.
- The graph allows one to make comparisons between and among quantities.
- Two sets of data may be graphed on a double bar graph with different colors or patterns used to indicate the different sets.
Example
Bar Graph Interactive
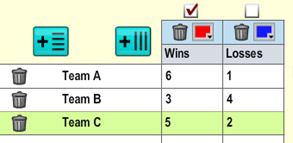
Select bar graph. Create a row in the table for each of the bars in your data set. The sample data below could be used to make three different graphs: Wins, Losses, and Wins and Losses.
Non-example
Favorite Pet is an example of a picture graph.