Bar-type Graph
My Definition
Key Characteristics
The following are true of a bar-type graph:
- Bars of the same width are divided into countable sections to represent the frequency of data values in a data set.
- Each section represents one data point.
- Data may be numerical or categorical.
- A bar-type graph allows comparisons between and among quantities to be made.
Example
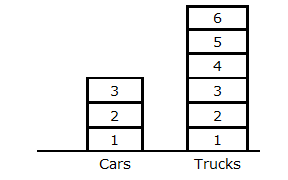
Vehicles Noted in Parking Lot
represents a bar-type graph of data.
Vehicles Noted in Parking Lot
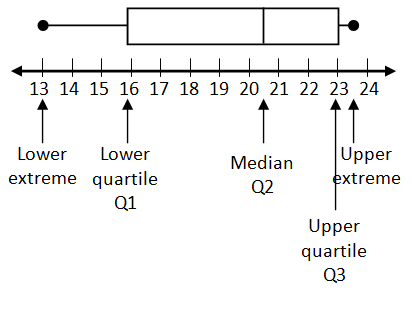
Non-example
This is an example of a box-and-whisker plot.