Comparative Box Plot
My Definition
Key Characteristics
The following are true of a comparative box plot:
- It is used to compare multiple sets of data describing the same, single variable.
- It uses separate box plots for each data set.
- It allows comparisons of the median (center), upper and lower extremes, quartiles, interquartile range (IQR), and range between and among multiple data sets.
- The shape of the box plot may be used to compare the spread of the data.
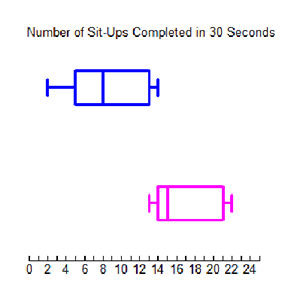
Example
The data represented in the blue box plot are from people who have just started to work with a personal trainer.
The data represented in the pink box plot are from people who have worked with a personal trainer for two months.
How are they similar?
How are they different?
What comparison statements can you make about these two sets of data?
Non-example
Non-example-1
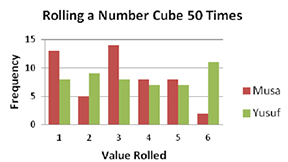
A double-bar graph can also be used to compare data sets.
Non-example-2
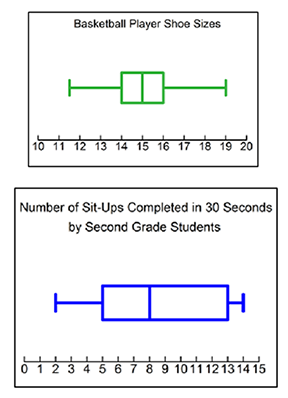
In order to make comparisons, the box plots must describe the same variable.