Interactive popup. Assistance may be required.
Determine the ratio of the change in the dependent variable (distance) to the change in the independent variable (time). Rate of Change = change in y over change in x
Change in y
Change in x
= 340 miles – 170 miles over 4 hours – 2 hours
340 miles – 170 miles
4 hours – 2 hours
= 170 miles over 2 hours
170 miles
2 hours
= 85 miles per hour
Rate of Change = change in y over change in x
Change in y
Change in x
= 340 miles – 170 miles over 4 hours – 2 hours
340 miles – 170 miles
4 hours – 2 hours
= 170 miles over 2 hours
170 miles
2 hours
= 85 miles per hour
Interactive popup. Assistance may be required.
Write a sentence relating the distance traveled to each hour driven.
Interactive popup. Assistance may be required.
For each hour traveled, the distance increases by 85 miles.
 Click on the graph below to plot the points from the table.
Interactive popup. Assistance may be required.
Which of the two numbers is greater?
Interactive popup. Assistance may be required.
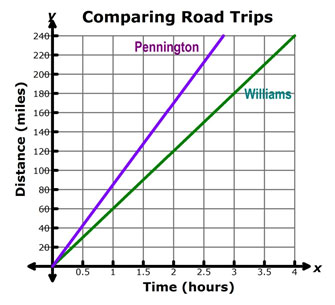
Williams Family Road Trip
Rate of Change = change in y over change in x Change in y Change in x = 340 miles – 170 miles over 4 hours – 2 hours 120 miles – 60 miles 2 hours – 1 hour = 170 miles over 2 hours 60 miles 1 hour = 60 miles per hour
Pennington Family Road Trip
Rate of Change = change in y over change in x Change in y Change in x = 340 miles – 170 miles over 4 hours – 2 hours 340 miles – 170 miles 4 hours – 2 hours = 170 miles over 2 hours 170 miles 2 hours = 85 miles per hour
Interactive popup. Assistance may be required.
Graph both relationships on the same set of axes, and compare the two lines.
Interactive popup. Assistance may be required.
The graph of the data for the Pennington family road trip is steeper than the graph of the data for the Williams family road trip.