In a previous resource, you used concrete models, such as algebra tiles, to solve quadratic equations. You have also used tables to solve quadratic equations. In this resource, you will investigate ways to use a graph to represent and determine the solution to a quadratic equation.
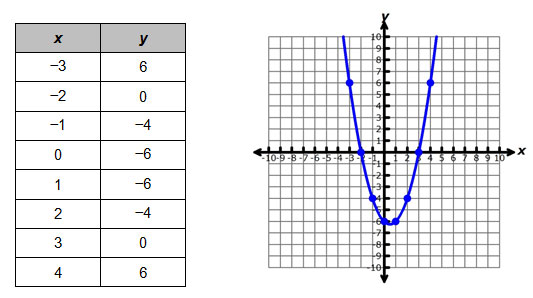
The graph and table below show points for the quadratic function, y = x2 − x − 6.

Both the graph and the table of values can be used to solve the equation, x2 − x – 6 = 0, which is related to the function y = x2 − x − 6. In a previous resource, you used tables to determine which x-values generated particular y-values that were used to solve the equation. In this resource, you will use similar thinking to locate points on graphs that satisfy particular conditions.