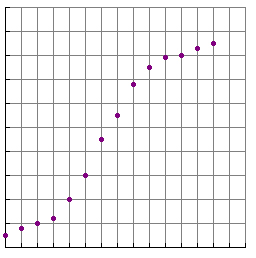
The last scatterplot we will look at is the logarithmic scatterplot. This data looks like an s-curve.
Below is data collected to see how much of a medicine is absorbed into the body.
| Hours | Absorption |
| 0 1 2 3 4 5 6 7 8 9 10 11 12 13 |
0.05 0.08 0.10 0.12 0.20 0.30 0.45 0.55 0.68 0.75 0.79 0.80 0.83 0.85 |
The applet you have been using does not graph logarithmic. Plotting the points yields the following graph.