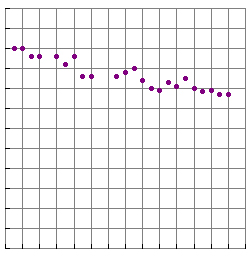
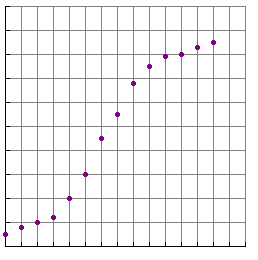
1) Which type of scatterplot is represented by the data graphed to the right?

Interactive popup. Assistance may be required.

A. Exponential

Correct! The vertical points give it away.
Close Pop Up

Interactive popup. Assistance may be required.

B. Logarithmic

Incorrect, logarithmic scatterplots are s-shaped.
Close Pop Up

Interactive popup. Assistance may be required.

C. Linear

Incorrect, not the shape of a line.
Close Pop Up

Interactive popup. Assistance may be required.

D. Quadratic

Incorrect, the vertical points tells you it's something else.
Close Pop Up

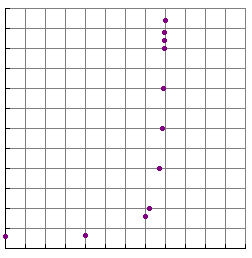
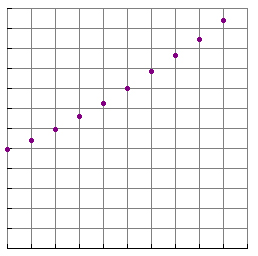
2) Which type of scatterplot is represented by the data graphed to the right?


Interactive popup. Assistance may be required.

A. Exponential

Incorrect, you'd see more vertical points.
Close Pop Up


Interactive popup. Assistance may be required.

B. Logarithmic

Incorrect, logarithmic scatterplots are s-shaped.
Close Pop Up

Interactive popup. Assistance may be required.

C. Linear

Incorrect, not the shape of a line.
Close Pop Up

Interactive popup. Assistance may be required.

D. Quadratic

Correct! You can see the right half of a U.
Close Pop Up

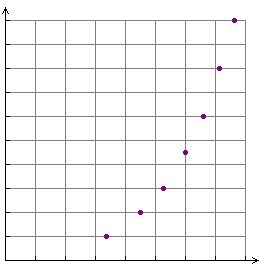
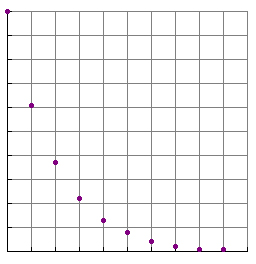
3) Which type of scatterplot is represented by the data graphed to the right?

Interactive popup. Assistance may be required.

A. Exponential

Incorrect, no curve to the points.
Close Pop Up

Interactive popup. Assistance may be required.

B. Logarithmic

Incorrect, logarithmic scatterplots are s-shaped.
Close Pop Up

Interactive popup. Assistance may be required.

C. Linear

Correct! Points are going up similar to a line.
Close Pop Up

Interactive popup. Assistance may be required.

D. Quadratic

Incorrect, no curve to the points.
Close Pop Up


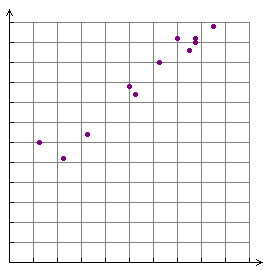
4) Which type of scatterplot is represented by the data graphed to the right?

Interactive popup. Assistance may be required.

A. Exponential

Incorrect, the points would continue to rise rapidly.
Close Pop Up

Interactive popup. Assistance may be required.

B. Logarithmic

Correct! Logarithmic scatterplots are s-shaped.
Close Pop Up

Interactive popup. Assistance may be required.

C. Linear

Incorrect, not the shape of a line.
Close Pop Up

Interactive popup. Assistance may be required.

D. Quadratic

Incorrect, this is not U-shaped.
Close Pop Up

5) Which type of scatterplot is represented by the data graphed to the right?

Interactive popup. Assistance may be required.

A. Exponential

Incorrect, the data is not growing fast enough.
Close Pop Up

Interactive popup. Assistance may be required.

B. Logarithmic

Incorrect, logarithmic scatterplots are s-shaped.
Close Pop Up

Interactive popup. Assistance may be required.

C. Linear

Incorrect, there is a slight curve to the data.
Close Pop Up

Interactive popup. Assistance may be required.

D. Quadratic

Correct! There is a slight curve to the data points.
Close Pop Up


6) Which type of scatterplot is represented by the data graphed to the right?


Interactive popup. Assistance may be required.

A. Exponential

Correct! This is exponential decay.
Close Pop Up


Interactive popup. Assistance may be required.

B. Logarithmic

Incorrect, logarithmic scatterplots are s-shaped.
Close Pop Up


Interactive popup. Assistance may be required.

C. Linear

Incorrect, not the shape of a line.
Close Pop Up

Interactive popup. Assistance may be required.

D. Quadratic

Incorrect, this is not U-shaped.
Close Pop Up


7) Which type of scatterplot is represented by the data graphed to the right?

Interactive popup. Assistance may be required.

A. Exponential

Incorrect, no curve to the points.
Close Pop Up

Interactive popup. Assistance may be required.

B. Logarithmic

Incorrect, logarithmic scatterplots are s-shaped.
Close Pop Up


Interactive popup. Assistance may be required.

C. Linear

Correct! Negative correlation.
Close Pop Up

Interactive popup. Assistance may be required.

D. Quadratic

Incorrect, no curve to the points.
Close Pop Up