This lesson focuses on one of the methods for solving a system of equations - using a table of values. The solution to a system is the point, or points, of intersection between all of the equations within the system.
There can be 0, 1, or infinitely many solutions when a system involves two linear equations. This lesson shows how to use a data table to solve a system. The example below will show you how to do that.
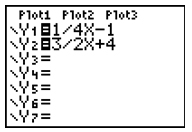
Example: Solve the system
Solution:
Since both equations are solved for y, they are very easy to enter into your graphing calculator.
To have a better idea of where to look in the table for the solution, go ahead and look at the graph.
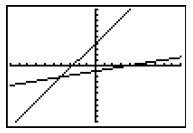
It appears that the two lines intersect close to where x is -4, so scroll in the table to where you can see -4 or set the table to begin at -4.
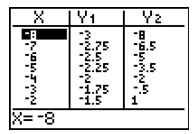
We have the point of intersection when both y-coordinates are the same for an x-coordinate.
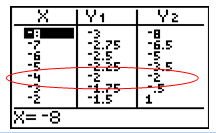
The solution is the point (-4, -2).