 using a data table.
The example below will show you how to find solution(s) to a system of one linear and one non-linear equation using a table. The process is like using a table to find the solution for a system of linear equations except there may be more points of intersection.
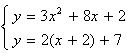
Example: Solve the system using a data table.
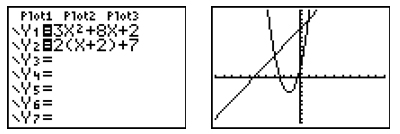
Solution: Enter both equations into your graphing calculator and get an idea about the points of intersection by taking a quick look at the graph. One of these equations is a parabola. Remember from the video, there could possibly be two points of intersection.
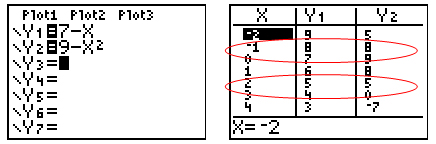
There, indeed, are two points of intersection. Set the table to start around x = -4.
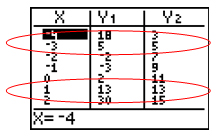
Fortunately, this time, both points of intersection are found within this window. If they had not been, we would have needed to scroll through the table. The solutions are both (-3, 5) and (1, 13).
Try this problem on your own:
Solve: