If you do not want to graph by hand, you can use an applet on the computer.
 If you do not want to graph by hand, you can use an applet on the computer.
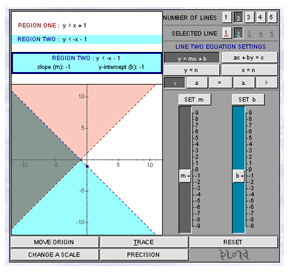
Source: Systems of Linear Inequalities Graph Applet, Ron Blond
Use the applet above to graph the following two inequalities.
y > x + 1
y < -x − 1
The region shaded by each inequality represents the set of points that are true for that inequality. For example, the point (1,5) is a possible solution to the inequality. Use the values of the point in the inequality y > x + 1 to prove it is a possible solution.
y > x + 1
5 > 1 + 1
5 > 2 TRUE
The point (1 , -5) is a possible solution to the inequality y < -x − 1. Use the values of the point in the inequality to prove it is a possible solution.
y < -x − 1
-5 < -1 − 1
-5 < -2 TRUE
The point (-5 , 1) is a possible solution to both of the inequalities. Use the values of the point in both inequalities to prove it is a possible solution to the system
y > x + 1
1 > -5 + 1
1 > -4 TRUE
y < -x - 1
1 < −(-5) − 1
1 < 5 − 1
1 < 4 TRUE
The solution to a system of inequalities is represented on a graph by the region that is shaded by both or all of the inequalities in the system.