
 Now that the inequalities are in the form y = mx + b, use the applet to graph the system.
In order to graph a system of inequalities written in standard form, rewrite each inequality into y = mx + b form.
The system of inequalities shown below is written in standard form.
3x + 4y ≥ -24
x − 5y ≥ 20
Rewrite each inequality into y = mx + b form.
3x + 4y ≥ –24
4y ≥-3x − 24
y ≥ - three-fourths
3
4
x − 6
x − 5y ≥ 20
–5y ≥ -x + 20
*y ≤ one-fifth
1
5
x − 4
*Reverse the inequality sign when multiplying or dividing by a negative number.
Now that the inequalities are in the form y = mx + b, use the applet to graph the system.
Look for the region that is shaded by both inequalities.
Source: Systems of Linear Inequalities Graph Applet, Ron Blond
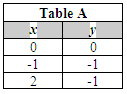
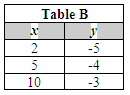
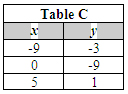
Shown below are four tables of coordinate values.
 |
 |
 |
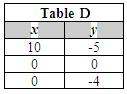 |
Which table contains values of the solution region of the inequalities you just graphed?
Now use the applet above to graph the system:
y ≤ 2x − 6
y ≥ 2x − 3
There is no solution to this system because there are no points on the graph that the two inequalities have in common. There is no double-shaded region. This also means that there is no single point that could be substituted in both of these inequalities and they both be true.
