Before you can model situations with quadratic functions you need to have a good grasp of what quadratic models are.
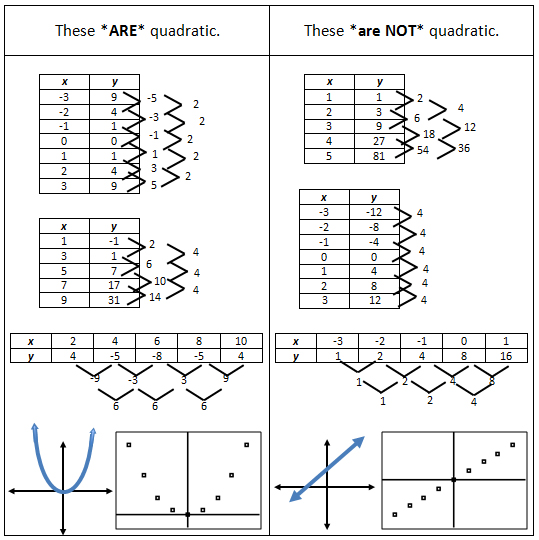
Look at the chart below. On the left hand side of the chart are examples of tables, graphs, and scatterplots that represent quadratic functions. On the right hand side of the table are examples of tables, graphs and scatterplots that DO NOT represent quadratic functions. Your first task is to study the left vs. the right hand sides of this chart and try to figure out the characteristics of quadratic functions. Then record a summary of your findings using your notes.
Remember to record your observations about first and second differences, graphs, and scatterplots.