
| Wind Speed (in miles per hour) |
Pressure (in lbs of force per square foot) |
| 10 | 1.0 |
| 20 | 1.6 |
| 30 | 2.8 |
| 40 | 4.3 |
| 50 | 5.9 |
| 60 | 8.1 |
| 70 | 11.0 |
| 80 | 14.0 |
Another method for finding a best-fit model is using graphing technology – either a graphing calculator or available computer software/applets. We will look at both technologies!
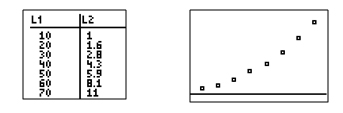
Below is a table with data of values showing the speed of the wind and the pressure caused by the wind against the side of a skyscraper building. As you probably expect . . . the greater the wind speed, the greater the pressure against the side of the building.
| Wind Speed (in miles per hour) |
Pressure (in lbs of force per square foot) |
| 10 | 1.0 |
| 20 | 1.6 |
| 30 | 2.8 |
| 40 | 4.3 |
| 50 | 5.9 |
| 60 | 8.1 |
| 70 | 11.0 |
| 80 | 14.0 |
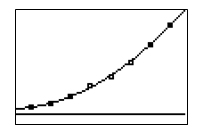
First, enter the data into L1 and L2 on your calculator and create a scatterplot of your data. Be sure to set an appropriate viewing window that will enable you to ‘see’ your data.
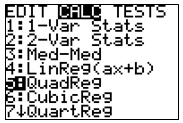
Next, go to Stat > Calc and choose 5: QuadReg and hit ‘ENTER’ to use the calculator’s regression command to create the model.
Then type L1, L2 ,Y1 after the command to tell that calculator that the x-values you want to model are in L1, the y-values are in L2, and the equation for the model should be stored in Y1.
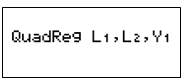
Next, press ‘ENTER’ to have the calculator find a model to fit the given data.
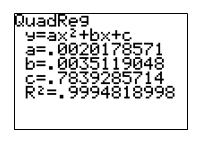
Finally, press GRAPH to see how closely your quadratic model fits the data in your scatterplot. The Correlation Coefficient tells you how close of a fit the line (or curve) is. The closer the number is to 1, the better the fit you have.
*If you need help entering data into lists in your calculator and performing regression analysis, check out this  online tutorial.