In this resource, you will be focusing on the information given in a verbal description that will allow you to sketch a graph, create a table, or write an equation of the function described.
A quadratic function can be modeled several ways, such as the path of a bouncing ball, an object falling, or the area of a figure/object.
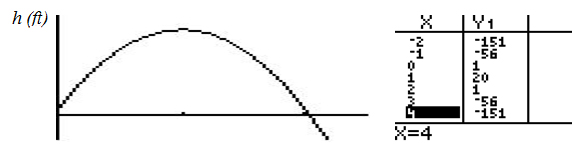
The path of a football that has been punted can be modeled by a quadratic function comparing the time (t) since the football was kicked to the height (h) of the ball.
Analysis of the above graph and table will tell you the ball reached its maximum height in 1 second and it reached 20 feet above ground. At 0 seconds, it was 1 foot off the ground and it was again 1 foot high at 2 seconds. The key here is to make connections between the verbal description of the action, the graph representing the path of the ball, and the table of values associated with the height of the ball over time. What was the height of the ball after 1 second?
