A quadratic function is one that relates a dependent variable to the square (2nd power) of the independent variable.
Quadratic functions can be represented in four different ways:
Each of these representations gives us information about the function and the relationship between two variables.
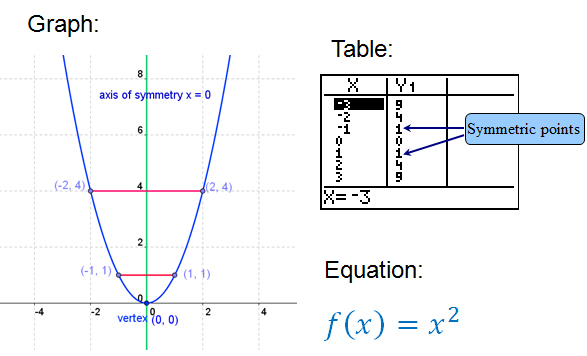
“The quadratic parent function has a minimum (vertex) at the origin, has one x-intercept at (0,0), and its line of symmetry is the y-axis (x = 0).”
The quadratic parent function is represented below in three ways.
Can you identify the coordinates of the vertex and intercepts and the equation of the line of symmetry?
vertex Interactive button. Assistance may be required. __________ (0,0)
y-intercept Interactive button. Assistance may be required. __________ (0,0)
x-intercept Interactive button. Assistance may be required. __________ (0,0)
(vertical) line of symmetry Interactive button. Assistance may be required. __________ x = 0 (y-axis)
Every point on the graph of a quadratic function except the vertex has a point that is symmetric to it (reflected across the line of symmetry). Pairs of symmetric points will have the same y-values. Notice the points designated and shown on the table:
(1, 1) and (-1, 1),
(2, 4) and (-2, 4),
(3, 9) and (-3, 9)
Use your graphing calculator to investigate by scrolling up and down the table of values to see the infinite number of symmetric points.
Go to Y= and enter x2.
Press 2nd then Graph to see the table.
(If you want to begin your exploration at the same place on your table as you see above, press 2nd, then Window to set the starting x value for your table. Choose 1 for ΔTbl to get the same increments as above)
For additional calculator help see the resource section.
