Now, let's look at some descriptions and how they relate to other representations.
The roots indicate the x-intercepts (zeros) of the graph of the function.
The maximum point is the vertex and indicates the parabola opens downward, since for the parabola to open upward, the vertex has to be the lowest point (minimum) on the graph.
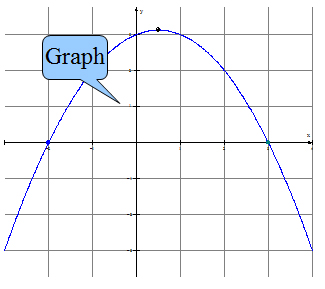
A sketch of the graph might look like this:
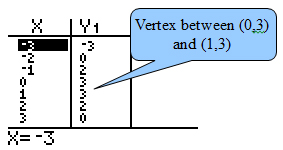
By comparing the points on the graph to the values in the table, you can see the coordinates of the x-intercepts (zeros) are (-2, 0) and (3,0). The table shows the y-values increasing from -3 to 3, then repeating the other direction, showing the vertex occurring between x values of 0 and 1, or at 0.5, and the y-coordinate just above 3, since the two values on either side of the maximum are both exactly 3.
Since the zeros occur when x = -2 and x = 3, the equation can be written in factored form using the zeros to write the factors of the quadratic. In order to have a parabola that has a maximum (opens downward), the coefficient of the x2 term must be negative.

Is there only one possible quadratic function that models the description given above? Study the following graph.
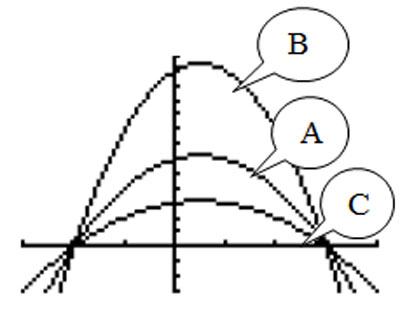
Which of these graphs model the description?

These graphs differ in the value of the coefficient of x2 or “a”
Are there others? Try entering the three equations into your graphing calculator