Follow the steps below using your graphing calculator.
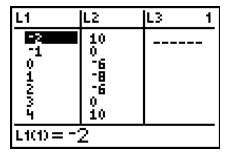
- Create a scatter plot of the points from the table by entering the x-values into L1 and the y-values into L2. (Press the S button, then press e to enter data into the LISTs)
- Go to the StatPlot menu by pushing 2nd, then Y=.
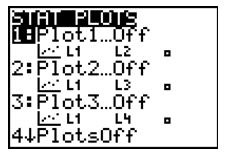
- Choose one of the Plots (1, 2, or 3) by pressing e or the number.
- On the Plot Menu, you do the following:
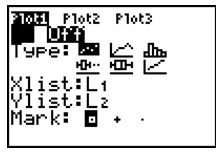
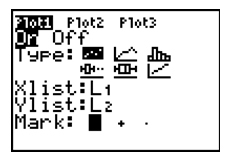 Turn the Plot ON by putting your cursor over the ON and pressing e.
- Choose the Scatter plot Type of graph by putting your cursor on the first icon on that menu and pressing e.
- Make sure the Xlist is L1 and the Ylist is L2. If either or both need to be changed, just put your cursor on the one you want to change and press 2nd, then the number of the list you need (for L1, press 1, etc.)
- Choose a Mark for your points on your plot.
- Choose the large “box” mark since there aren’t many points.
- Set the viewing Window for your scatter plot by pressing WINDOW (second from the left just underneath the graph screen).
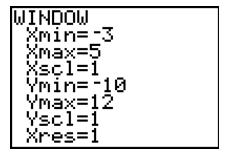 To set the viewing WINDOW, you need to consider the domain and range of your data (points).
- Set the Xmin slightly less than the lowest x-value of your points and the Xmax slightly greater than the largest x-value of your points. Xscl can be set to 1.
- Set the Ymin slightly less than the lowest y-value of your points and the Ymax slightly greater than the largest y-value of your points. Yscl can also be set to 1.
- Leave Xres = 1
- Press GRAPH and you should see all the points on your scatter plot.
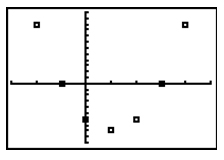
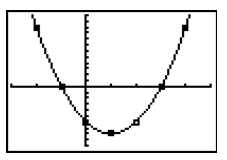
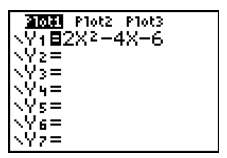
- Now go to Y= and enter your equation from above 2x2 - 4x - 6 and press GRAPH.
- Since the graph of the equation goes through each and every point of the scatter plot, you can be assured your equation is the correct one for this graph! Voila!