Now that you have seen the processes for translating from a table to the other three representations of a quadratic function, let's try one more so that you can check your understanding.

If you need help, mouse over the critical points column.
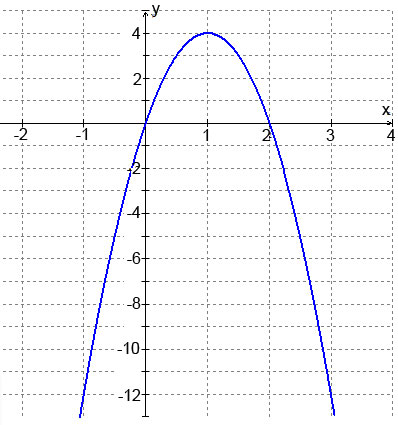
The data in the table below represents a quadratic function.
x |
-1 |
0 |
1 |
2 |
3 |
4 |
y |
-9 |
0 |
3 |
0 |
-9 |
-24 |
Use your notes to explain how you would develop a specific equation for this quadratic function. When you have an equation, check your answer with your graphing calculator.
Again, use your notes to write a verbal description from the table given above. Before writing out your description, identify some of the critical attributes by coordinates, then use chosen attributes in your description.
