In this resource, you will be using a graph to write the equation, create a table, and/or verbalize a description of the function.
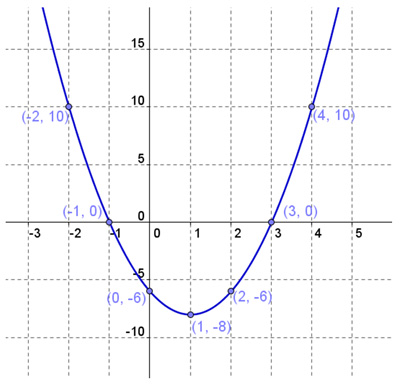
Given the graph below, how would you generate a table of values?
x |
y |
Critical Attribute |
|---|---|---|
-2 |
10 |
|
-1 |
0 |
x-intercept |
0 |
-6 |
y-intercept |
1 |
-8 |
Vertex (minimum) |
2 |
-6 |
Symmetric point |
3 |
0 |
x-intercept |
4 |
10 |
Notice the coordinates of the indicated points on the graph, including the vertex (minimum) at (1, -8).
This table displays the same coordinates in numerical order by x coordinates. It is not required that the table be in order, but the order reveals the shape of the parabola and the vertex (minimum y-value) as well as the x-intercepts and y-intercept.