Now that you have seen the processes for translating from a graph to the other three representations of a quadratic function, let’s try one more so that you can check your understanding.
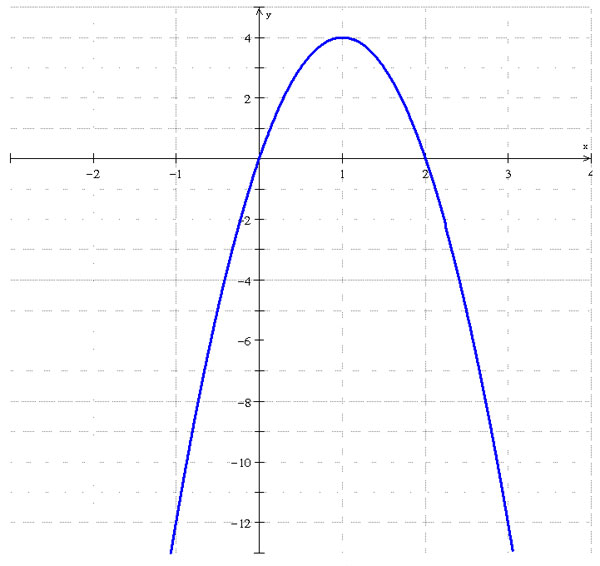
Fill in the missing values in the table with coordinates of specific points you can read on the graph above.
x |
y |
Using ordered pairs from your table or directly from the graph, write on paper how you would develop a specific equation for this quadratic function. When you have an equation, check your answer with your graphing calculator:
Using your notes write a verbal description of the graph given for this problem. Before writing out your description, identify some of the critical attributes by coordinates, then use chosen attributes in your description. Can you also tell if your description would be enough to write a specific equation?
