In this section, you will be creating a table of values from a given graph.
You will be given the graph of a
quadratic function and asked to create a table of values for it.

Example
Use the graph shown below to create a table of values.
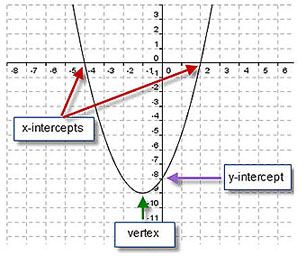
| x |
y |
critical attributes |
-4 |
0 |
x-intercept |
2 |
0 |
x-intercept |
0 |
-8 |
y-intercept |
-1 |
-9 |
vertex (minimum) |
-3 |
-5 |
point on parabola
When picking points that are NOT critical attributes try to pick points whose coordinates appear to be integers. |
1 |
-5 |
point on parabola |
-2 |
-8 |
point on parabola |
Click for more information.