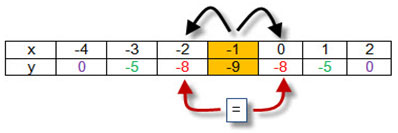
Notice that if you move the same number of units to the left or right of the vertex, the y-coordinates are the same. For example, one x-unit to the left and to the right of (-1, -9) have the same y-coordinates, (-2, -8) and (0, -8).
If you move two x-units to the left or right of the vertex of (-1, 9), the y-coordinates are also the same, (-3, -5) and (1, -5).
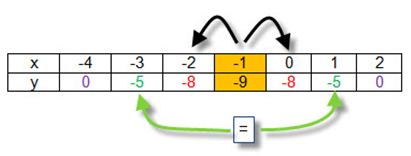
Therefore, once you identify the vertex of a parabola, you can use symmetry to find points for your table.
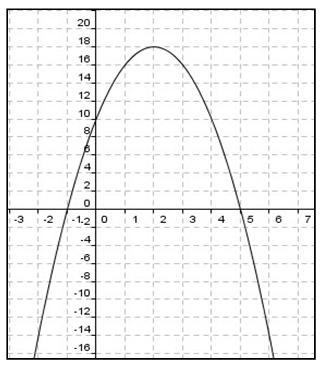
Use the graph shown below to create a table of values.
x |
y |
critical attributes |
-1 |
0 |
x-intercept |
5 |
0 |
x-intercept |
0 |
10 |
y-intercept |
2 |
18 |
vertex |
1 |
16 |
a point on the graph |
3 |
16 |
a point on the graph symmetric to the one above |
-2 |
-14 |
a point on the graph |
6 |
-14 |
a point on the graph symmetric to the one above |