In this lesson, you will learn how the vertex, maximum value or minimum value, and intercepts can help you create the graph of a quadratic function.

A pencil and graph paper are needed to do this activity.

Graph Paper

Vertex/Minimum Value/Maximum Value

Recall that a parabola is the graph of a quadratic function.

Parabola opening up

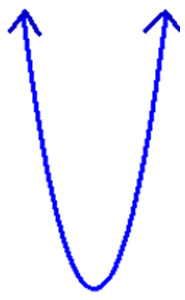
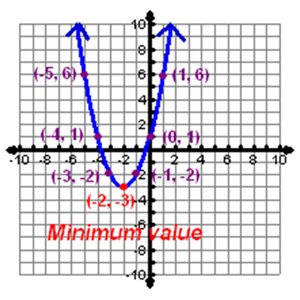
For a parabola which opens up, the lowest point on the parabola is the vertex.

Graph of parabola opening up, vertex at (-2,-3)

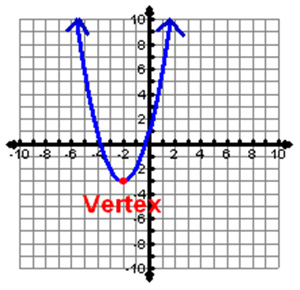
Notice that the y-coordinate of the vertex is the minimum y-value for this function.

For a parabola which opens up, the y-coordinate of the vertex is the minimum value.

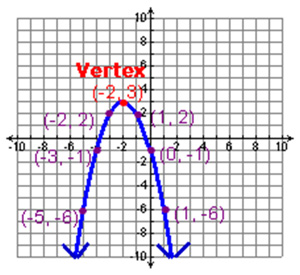
For a parabola which opens down, the highest point on the parabola is the vertex.

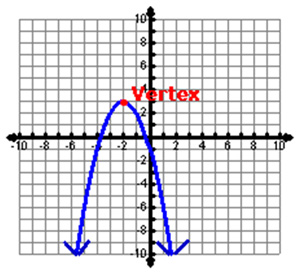
Notice that the y-coordinate of the vertex is the maximum y-value for this function.

For a parabola which opens down, the y-coordinate of the vertex is the maximum value.

Parabola opening downward

Name the vertex for the parabola below. Then state whether the y-coordinate of the vertex is the minimum or maximum value.

Interactive popup. Assistance may be required.

Check Your Answer

The vertex is (-3, 2).
2 is the maximum value. Close Pop Up