In this section, a graphing calculator is used to solve quadratic functions.
Follow the steps below to find the x-intercepts of a quadratic function using a graphing calculator.
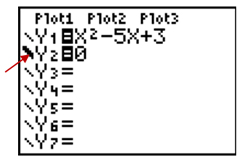
Example: Solve x2 − 5x + 3 = 0
Step 1: Enter quadratic equation into calculator for [Y1].
Step 2: Enter y=0 for [Y2].
Step 3: Using left arrow [⇐], move cursor to line descriptor on the left of [Y2] and press [ENTER] to bold this line.
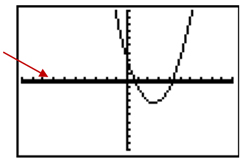
Step 4:[GRAPH] (Notice, y=0 is a bold line on the y-axis.)
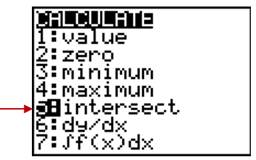
Step 5: Choose [2nd][TRACE] to get the CALCULATE menu.
Step 6:Since the x-intercept (or zero or root) is where the graph intersects the x-axis, choose 5: intersect [ENTER].
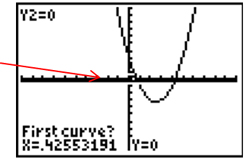
Step 7: Move the cursor or blinking light to one of the x-intercepts.
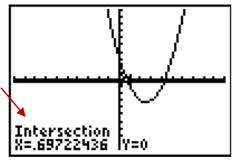
Step 8: When the question "First Curve?" appears on the screen make sure your cursor is on either the parabola or the x-axis and press [ENTER]. The question "Second curve?" should appear. Check to be sure your cursor is on the other curve. Press [ENTER]. The question "Guess?" should appear. Move your cursor close to the intersection you are trying to find and press [ENTER]. One of the x-intercepts is (0.70, 0).
Step 9: Repeat steps 5 to 8 to get the second x-intercept. The solution set is {0.70, 4.30}.
The following problem is an example of finding a solution when it is difficult to see where the graph of the quadratic equation touches the x-axis.
Example: Solve 0 = -2x2 + 3x - 1
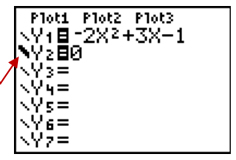
Step 1: Enter quadratic equation into calculator for [Y1].
Step 2: Enter 0 for [Y2]
Step 3: Using left arrow [⇐], move cursor to line descriptor on the left of [Y2] and press [ENTER] to bold this line.
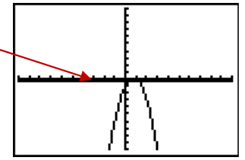
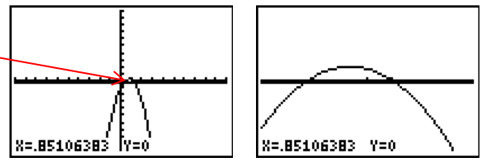
Step 4: [GRAPH] (Notice, y=0 is a bold line on the y-axis.)
It appears that there could be one or two x-intercepts.
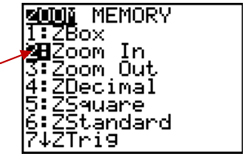
Step 5: To get a closer look, you can zoom in by choosing [ZOOM].
Step 6:< Then choose 2:Zoom In
Step 7: Move blinking light to the area you want to zoom in to. Press [ENTER] as many times as needed to get a clear window.
Step 8: Choose [2nd][TRACE] to get the CALCULATE menu.
Step 9: Next choose 5: intersect [ENTER].

Step 10: Move the cursor or blinking light to one of the x-intercepts.
Step 11: When the question "First Curve?" appears on the screen make sure your cursor is on either the parabola or the x-axis and press [ENTER]. The question "Second curve?" should appear. Check to be sure your cursor is on the other curve. Press [ENTER]. The question "Guess?" should appear. Move your cursor close to the intersection you are trying to find and press [ENTER].
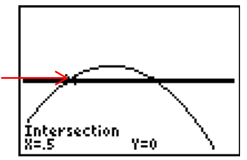
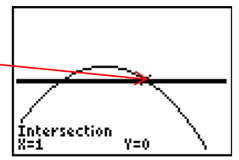
Step 12: Repeat steps 8 to 11 to get second x-intercept.
The solution set is {0.5, 1}
Solve the following quadratic equations using a graphing calculator. Round to nearest hundredth.

In your notes, describe how to use the table method in conjunction with the graphing method to solve a quadratic equation.