Let’s Now Begin Looking at Quadratic Inequalities

The idea of an infinite solution set applies to quadratic inequalities as well. You know from your study of quadratic equations that they can have zero, one, or two real solutions.

A quadratic inequality can have from zero to infinite solutions.

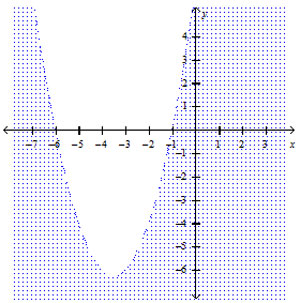
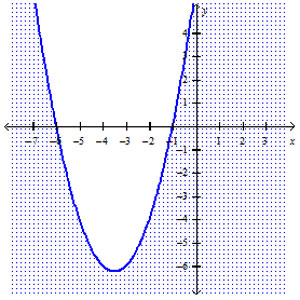
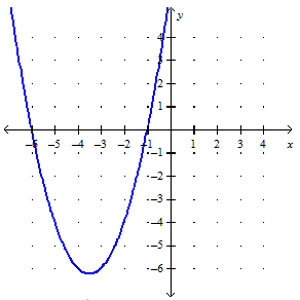
Look at the function y = x2 + 7x + 6. Two solutions occur when y = 0.

Let's begin with an equation:
Factor and solve:

x2 + 7x + 6 = 0
(x + 1)(x + 6) = 0
x +1 = 0 or x + 6 = 0
x = -1 or -6

The solutions are two x-values and are indicated by the x-intercepts on the graph – the two finite points (-1, 0) and (-6, 0).

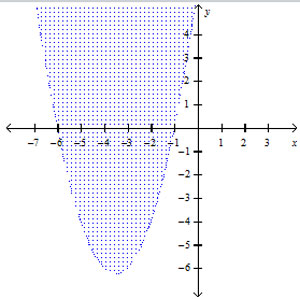
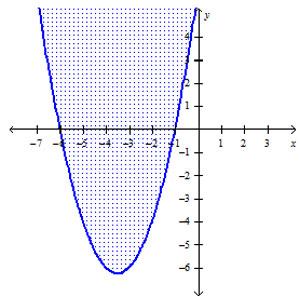
The above equation can be rewritten as four different inequalities (four different inequality signs):

  1. y < x2 + 7x + 6
  2. yx2 + 7x + 6
  3. y > x2 + 7x + 6
  4. yx2 + 7x + 6

Each of these represents a slightly different solution set.

To Solve by Graphing

  1. Graph the parabola just as you would an equation. (see above graph)
  2. Use a solid line for the parabola if the inequality is ≥ or
    and a dotted line for the parabola if the inequality is > or <
  3. If the inequality is written as y > or ≥, shade above the parabola and for yor <, shade below the parabola.
  1. y < x2 + 7x + 6 Parabola is dotted. Shade below the parabola.
    Interactive popup. Assistance may be required.

    See the Graph

    Close Pop Up
  2. yx2 + 7x + 6 Parabola is solid. Shade below the parabola.
    Interactive popup. Assistance may be required.

    See the Graph

    Close Pop Up
  3. y > x2 + 7x + 6 Parabola is dotted. Shade above the parabola.
    Interactive popup. Assistance may be required.

    See the Graph

    Close Pop Up
  4. yx2 + 7x + 6 Parabola is solid. Shade above the parabola.
    Interactive popup. Assistance may be required.

    See the Graph

    Close Pop Up