In application, one side of the inequality will often be a number (constant) instead of the variable “y.”
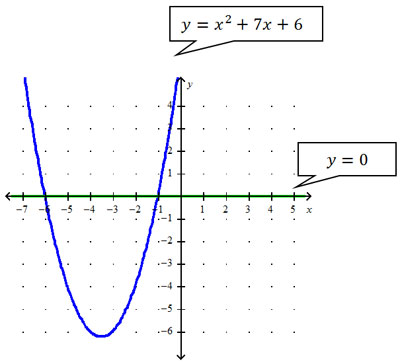
The solution set can be found using a graph or a table. Begin by graphing each side of the inequality on the same graph: y = x2 + 7x + 6 (blue graph) and y = 0 (green graph).
x2 + 7x + 6 ≥ 0 states that the left side (the quadratic or parabola) is greater than or equal to the right side (y = 0).
The parabola divides the x-axis into three intervals (segments). In this case, those intervals are described by three linear inequalities:
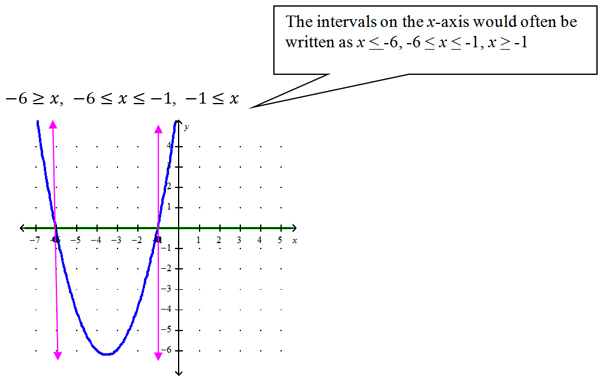
Now determine the interval(s) of the axis which satisfy the conditions of the inequality.
We are looking for the interval where the function on the left side (x2 + 7x + 6) is above (greater than) the function on the right (y = 0). Look at the points on the parabola that are above the green line on the graph. Which interval(s) of x values on the axis are below the parabola?
Therefore, the solution sets for this inequality are x ≤ -6 and x ≥ -1
If you change the inequality to x2 + 7x + 6 ≤ 0, the solution set is now the middle interval of the x-axis or -6 ≤ x ≤ -1
On the table, look for the y values that satisfy the conditions of the inequality:
f(x) = x2 + 7x + 6 ≤ 0
This means we look for y values that are 0 or negative. The blue shaded values on the table indicate those y-values.
| x | y |
| -9 | 24 |
| -8 | 14 |
| -7 | 6 |
| -6 | 0 |
| -5 | -4 |
| -4 | -6 |
| -3 | -6 |
| -2 | -4 |
| -1 | 0 |
| 0 | 6 |
| 1 | 14 |
| 2 | 24 |
| 3 | 36 |
The solution is the green shaded x-values (-6, -5, -4, -3, -2, -1) that generate the y-values (0, -4, -6, -6, -4 0), and all those in between the values listed on the table, since the function (and graph) is continuous.
Solution according to the table: -6 ≤ x ≤ -1 (same as derived from the graph).
