 Given y = √(3x + 4), make a table of values to represent this equation. The first row is completed for you. Drag and drop the remaining processes and y-values to complete the table.
 In the previous section, you generated tables of square root functions from algebraic and verbal descriptions. In this section, you will focus your attention toward generating graphs. Graphs allow you to see the defining characteristics of the function family. Graphs also allow you to be able to easily determine attributes such as domain, range, and the coordinates of the endpoint. Creating a graph using a graphing calculator is pretty easy. You type the equation into the function editor, usually the Y = menu, and press GRAPH. However, creating a graph by hand takes a little thought. Review the example below.
Given y = √(3x + 4), make a table of values to represent this equation. The first row is completed for you. Drag and drop the remaining processes and y-values to complete the table.
Now that the equation is in the form of a table, you can plot these points on a coordinate plane. Click on the graph below to plot the points and graph the function.
Interactive popup. Assistance may be required.


Interactive popup. Assistance may be required.
Domain {x | x ≥ - 4 over 3 4 3 }; Range {y | y ≥ 0}
Interactive popup. Assistance may be required.
It looks like at x = 2, y would be a little more than 3. Estimate y to equal about 3.2.
You have been generating graphs from tables and algebraic representations.
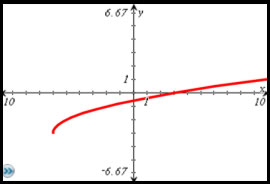
Above is a graph of a square root function. What is the algebraic equation for this graph? Explain how you determined the equation.
Interactive popup. Assistance may be required.
The equation is y = √(x + 6) – 3. You find this by determining the transformation. The graph is shifted to the left 6 units and down 3 units from the parent function.
What are the coordinates of the endpoint?
Interactive popup. Assistance may be required.
(−6, −3)
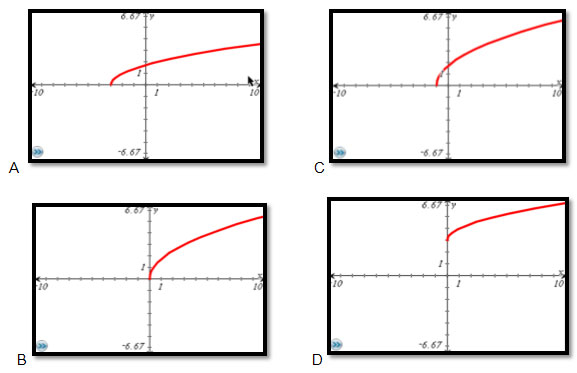
Interactive popup. Assistance may be required.
Determine the value of x that makes the number under the radical sign equal to zero.
Interactive popup. Assistance may be required.
C
Interactive popup. Assistance may be required.
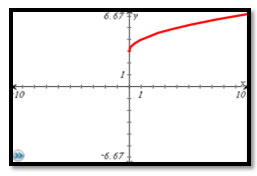
Find the starting point on the graph.
Interactive popup. Assistance may be required.
(0, 3)
Interactive popup. Assistance may be required.
Use the coordinates of the endpoint to determine the domain and range.
Interactive popup. Assistance may be required.
Domain {x | x ≥ 0}; Range {y | y ≥ 3}