In this section, you will be solving square root inequalities by graphing and using tables. You will need a calculator for this section.
| x | Substitute and Simplify Into the Inequality | y | Part of Solution Set? |
Note: Inequalities have one, an infinite number, or no solutions.
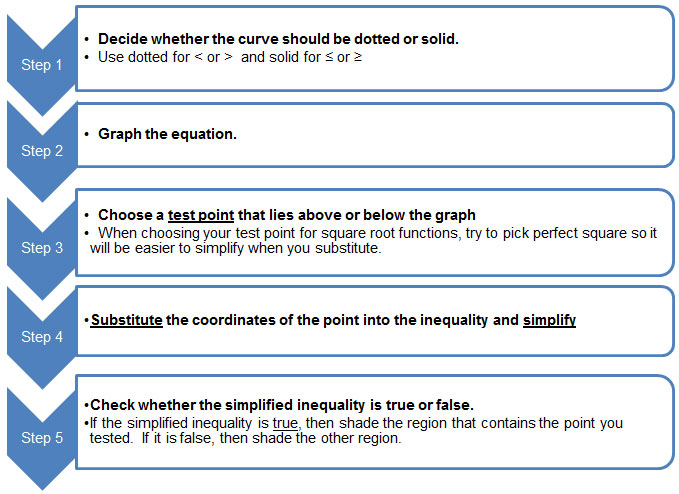
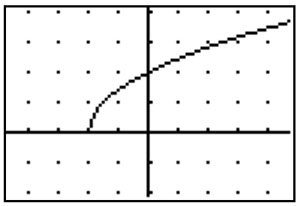
Example: y < √x
Step 1: Since the inequality symbol is <, the curve should be dotted.
Step 2: Graph function—Red graph
Step 3: Test point (1, 2) Remember to try to pick a point where x is a perfect square number.
Step 4: Substitute and simplify.
y < √x
2 < √1
2 < 1
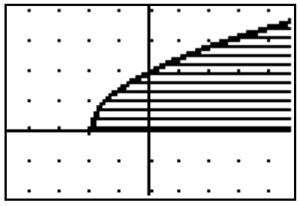
Step 5: This is false, so shade the other side of the graph.
| x | Substitute and Simplify Into the Inequality | y | Part of Solution Set? |
| 1 | y < √1 | .5 | Yes |
| 2 | y < √2 | 1 | Yes |
| 4 | y < √4 | 1 | Yes |
| 9 | y < √9 | 2 | Yes |
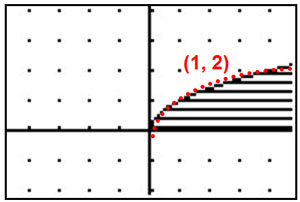
Example: y ≤ y < √x
Step 1: Since the inequality symbol is ≤, the curve should be solid.
Step 2: Graph—Red graph
Step 3: Test point, (1, 2) Remember to try to pick a point where x is a perfect square number.
Step 4: Substitute and simplify.
y ≤ √x
2 ≤ √1
2 ≤ 1
Step 5: This is false, so shade the other side of the graph.
| x | Substitute and simplify into the inequality | y | Part of solution set? |
| 1 | y ≤ √1 | .5 | Yes |
| 2 | y ≤ √1 | 1 | Yes |
| 4 | y ≤ √1 | 1 | Yes |
| 9 | y ≤ √1 | 2 | Yes |
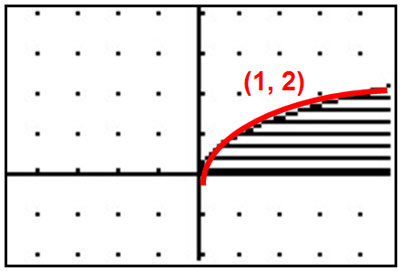
Below are graphs of the same function with different inequality signs.
y > √x
Since the inequality symbol is <, the curve should be dotted.
Pick a test point, say (1, 2)
Substitute and simplify.
y > √x
2 > √1
2 > 1
This is true, so shade the region of the graph that contains (1,2).
| x | y |
| 1 | 4 |
| 2 | 3 |
| 4 | 3 |
| 9 | 5 |

y ≥ x
Since the inequality symbol is <, the curve should be solid.
Pick a test point, say (1, 2)
Substitute and simplify.
y ≥ x
2 ≥ √1
2 ≥ 1
This is true, so shade the region of the graph that contains (1,2).
| x | y |
| 0 | 0 |
| 1 | 1 |
| 2 | √2 |
| 4 | 2 |
Is there any relationship between the symbol and shaded region of the graph?
Move your mouse over the blank to reveal the answers. (above or below)
The inequality < was shaded Interactive button. Assistance may be required. _______ below the curve.
The inequality ≤ was shaded Interactive button. Assistance may be required. _______ below the curve.
The inequality > was shaded Interactive button. Assistance may be required. _______ above the curve.
The inequality ≥ was shaded Interactive button. Assistance may be required. _______ above the curve.
Example 1: Graph y ≤ √2x + 4
Step 1: The inequality is ≤, the curve is solid.
Step 2: Graph
Notice that the graph is only in the 1st and 2nd quadrants because y cannot be negative.
Step 3: Pick a test point: (0,3)
Step 4: Substitute and simplify.
y ≤ √2x + 4
2 ≤ √2(0) + 4
2 ≤ 1
Step 5: Since 3 ≤ 2, this is false, so shade the other side of the graph.
OR
Notice the inequality is “less than” so shade below the graph.