Watch the following video for an explanation of how to solve this inequality on your graphing calculator using a table. You should follow along with your calculator as the instructor solves the problem on his calculator.
Example 1: Solve the following inequality using the table feature on your graphing calculator.
log6(x) + 10 ≤ 12
Watch the following video for an explanation of how to solve this inequality on your graphing calculator using a table. You should follow along with your calculator as the instructor solves the problem on his calculator.
Now that you've watched the video, try solving these problems on your own.
Practice 1: Solve 2log3(x) – 1 < 3 using the table feature on your graphing calculator.
Interactive popup. Assistance may be required. When 0 < x < 9, 2log3x – 1 < 3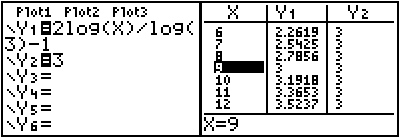

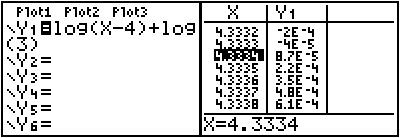
Practice 2: Solve log(x – 4) + log 3 ≤ 0 using the table feature on your graphing calculator.
Interactive popup. Assistance may be required. When 4 < x < 4.333, then log(x – 4) + log 3 ≤ 0.