Method 2:
Another method for finding a best-fit model is using a graphing calculator. Below is a table of values that shows a car's value, in dollars, over time, in years. As you might expect, a car's value begins to depreciate the minute it is driven off of the dealership's lot!
| # of Years Since Purchase of Car | Car's Value |
| 0 | 23000 |
| 1 | 19550 |
| 2 | 16618 |
| 3 | 14125 |
| 4 | 12006 |
| 5 | 10205 |
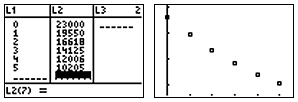
To use the calculator to find a regression model, you must first enter the data into L1and L2on your calculator and create a scatterplot of your data. Be sure to set an appropriate viewing window that will enable you to "see' your data.
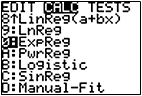
Next, go to Stat > Calc and choose 0: ExpReg and hit "ENTER' to select the calculator's regression command to create the model.
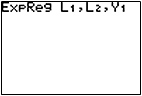
Then type L1, L2, Y1after the command to tell that calculator that the x-values you want to model are in L1, the y-values are in L2, and the equation for the model should be stored in Y1.
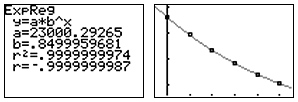
Next, press "ENTER' and let the calculator find a model to fit the given data and then "GRAPH' to see how well the model fits your data in your scatterplot. The Correlation Coefficient tells you how close of a fit the line (or curve) is. The closer the number is to 1, the better fit you have.