This section uses real-world examples to model contextual situations involving exponential equations. A graphing calculator is needed.
Example 1:
The demands on the IT Departments of corporations continues to increase because the capacity to store data must keep pace with the growing volumes of data as well as the demand for real-time access to the stored information.
Some examples of institutions continually increasing data storage are:
- The U.S. Library of Congress - almost 160 terabytes of data as of February, 2010, according to Wikipedia
- The banking industry - they must keep records of customers' checks, ATM transactions, and credit card information
- The healthcare industry - they must keep medical and pharmaceutical records.
The volume of data that requires storage might become problematic in the future.
Records show that, in 1998, there were 40.5 terrabytes* (*A terabyte is equivalent to 1000 gigabytes or 10^12 or 10,000,000,000,000 bytes of information.) of data stored in data warehouses.
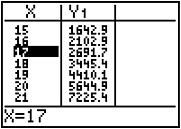
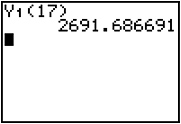
The exponential function y = 40.5 (1 + .28)x can be used to model this growth since 1998.
Use this model to predict the amount of data storage needed in the year 2015.
Interactive popup. Assistance may be required.
Check Your Answer
Example 2:
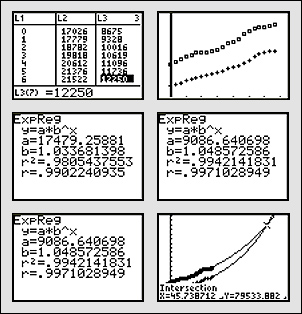
The table below lists women's and men's median earnings, in dollars, from 1984 through 2004, as reported by the U.S. Census Bureau. No doubt that the gap between men's earnings and women's earnings is narrowing. Will women's earnings overtake men's?
|
Year
|
Men's Median Earnings
(in dollars)
|
Women's Median Earnings
(in dollars)
|
|
1984
|
17026
|
8675
|
|
1985
|
17779
|
9328
|
|
1986
|
18782
|
10016
|
|
1987
|
19818
|
10619
|
|
1988
|
20612
|
11096
|
|
1989
|
21376
|
11736
|
|
1990
|
21522
|
12250
|
|
1991
|
21857
|
12884
|
|
1992
|
21903
|
13527
|
|
1993
|
22443
|
13896
|
|
1994
|
23656
|
14323
|
|
1995
|
25018
|
15322
|
|
1996
|
25785
|
16028
|
|
1997
|
26843
|
16716
|
|
1998
|
28755
|
17716
|
|
1999
|
30079
|
18440
|
|
2000
|
30951
|
20267
|
|
2001
|
31364
|
20851
|
|
2002
|
31647
|
21429
|
|
2003
|
32048
|
22004
|
|
2004
|
32483
|
22256
|
Find exponential functions that model the growth of men's median earnings and women's median earnings and then use a graphing calculator to decide whether or not women's median earnings will exceed men's, and if so, in what year will it occur?
Interactive popup. Assistance may be required.
Check Your Answer
Example 3:
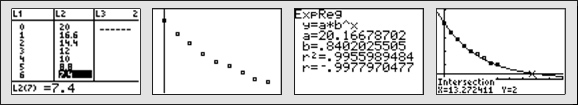
The table below shows the amount of a 20 mg dose of medication remaining in a person's bloodstream over eight hours. If 2.0 mg. is the therapeutic dosage and if the patient takes this medicine twice a day, will the amount of medication in the bloodstream dip below the therapeutic level in between doses? Why or why not?
|
Time (in hours)
|
0
|
1
|
2
|
3
|
4
|
5
|
6
|
7
|
8
|
|
Drug Amount (in mg)
|
20
|
16.6
|
14.4
|
12.0
|
10.0
|
8.8
|
7.4
|
5.6
|
5.0
|
Interactive popup. Assistance may be required.
Need a Hint?
Interactive popup. Assistance may be required.
Check Your Answer