 Use the equation and graph of the inverse of Function 2 to complete the ‘Table of Inverse’ below. Complete the table using your own paper. You can check your answers by moving your mouse over the table.
Look at the equation, graph, and table of Function 2 (with a restricted domain).
Use the equation and graph of the inverse of Function 2 to complete the ‘Table of Inverse’ below. Complete the table using your own paper. You can check your answers by moving your mouse over the table.
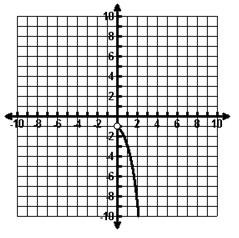
Function 2
Equation y = -3x
Graph of Function
Inverse of Function 2
Equation y = log3(-x)
Graph of Inverse
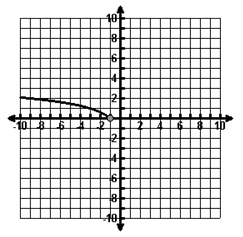
Table of Function
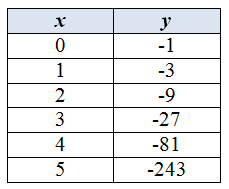
Table of Inverse
In your notes, answer the following questions.
