In this lesson, we will examine the domain, range, and horizontal asymptotes of exponential growth and decay functions of the following form:
f(x) = a * Bx - c + d,
where a, B, c, and d are constants.
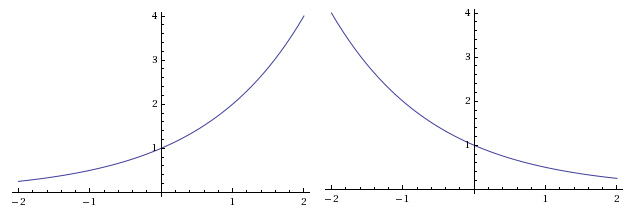
We will study two basic graphs:
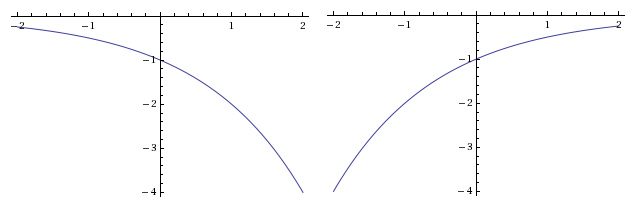
And their reflections if the lead coefficient (the a term) is negative:
Then, we will discuss vertical shifting and horizontal shifting of these graphs.
 First, let's study the effects of changing the base B in f(x) = a * Bx - c + d. Click below to view the interactive applet.
What is the original domain of the function before making any changes to B?
(-∞, ∞)
You begin with the function f(x) = 2x. Because you can raise 2 to any power, the domain is infinite.

What is the range?
(0, ∞)
If you raise 2 to any power, you get only positive numbers.
Does it have a horizontal asymptote? If so, where?
Yes, at y = 0. Since there is a horizontal flattening out of the graph as x approaches negative infinity (to the left), you have a horizontal asymptote. The graph gets really close to y = 0 (the x-axis), but never actually touches it.
Now, using the slider, change the base, B, to a value larger than 2. Does this change your domain, range, or horizontal asymptote?
No. Even though the graph has a larger rate of growth, the domain is still (-∞, ∞), the range (0, ∞), and the asymptote y = 0.
Next, slowly change B to values less than 2 until the shape of your graph changes from growth to decay. For what values of B will the graph become a decay model?
Does this affect your domain, range, or horizontal asymptote?
No. The domain is still (-∞, ∞), the range (0, ∞), and the asymptote y = 0.
Now let's study the effects of changing the a coefficient in our exponential form: f(x) = a * Bx - c + d
Slowly decrease the value of a by moving the slider to the left. Ignoring the case of a = 0, when do you see a dramatic change in range? What is the range after this occurs?
When a is negative the graph reflects across the x-axis. The range becomes (-∞, 0).
Is your domain affected?
Where is your horizontal asymptote?
Now, make sure your value for a is negative. Use the slider to change the value of B from 0.1 up to the maximum of 9.9. Does this changing of B alter the domain, range, or horizontal asymptote?
No. They all remain the same as they were before changing the value of B.
What does this tell you about the significance of a and B in exponential equations of the form f(x) = a * Bx - c + d?
Although B can change the graph from growth to decay depending if it is less than or greater than 1, it doesn't alter the domain, range, or asymptote. Changing a from positive to negative, however, does change the range from (0, ∞) to (-∞, 0) respectively.