Animal interactions can also be shown as graphs. Study each graph below. Decide which type of interaction is displayed in the graph.
Interactive popup. Assistance may be required.
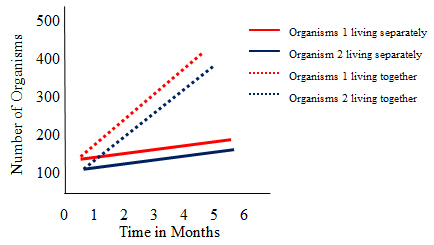
Mutualism
Interactive popup. Assistance may be required.
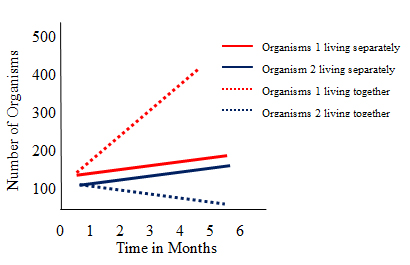
Parasitism
Interactive popup. Assistance may be required.
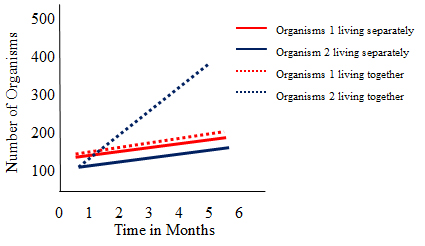
Commensalism
Interactive popup. Assistance may be required.
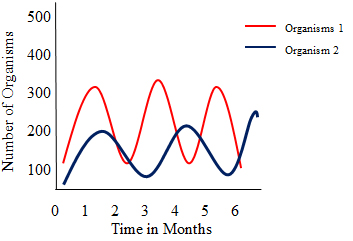
Predation