Data collected during an experiment and its repetitions are used to develop a conclusion. Data can either support the hypothesis or not support it. If your experimental results do not match your hypothesis, this does not mean your hypothesis is wrong. Perhaps you could redesign your experiment, or find sources of error.
When asked to identify conclusions based on investigation descriptions, data tables, graphs and drawings, remember to do the following:
Note that a good conclusion does not usually contain words such as best, worst, always, never. These words do not reflect on a hypothesis, are not measurable, and often connect to an opinion. Conclusions should be based on the data collected during the investigation and should be opinion and inference free.
Let's try making a valid conclusion together.
Read the description of the investigation and then analyze the graph.
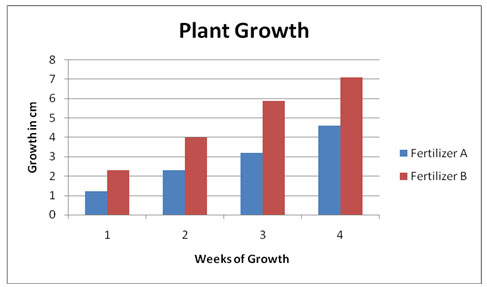
A student conducted a comparative investigation to see which fertilizer would have the greatest effect on the growth of a plant. She grew 10 plants of the same type in the same type and size of planter. She watered the plants the same amount, and each plant received the same amount of sunlight. She gave each plant the same amount of fertilizer, but she gave 5 of the plants Fertilizer A and the other 5 plants Fertilizer B. She measured the growth of the plants each week. Displayed in the graph below is the average growth of the plants each week.
 Which conclusion below is best supported by the data?