There are four types of relationships that you analyzed in this lesson.
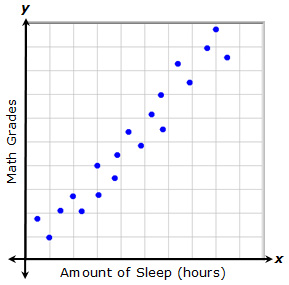
A relationship with a positive linear association is one in which both variables increase at the same time at an almost constant rate.
In this example, each point represents the amount of sleep that a student had and the grade that they received on a recent math quiz. As the amount of sleep increases, the math grade increases.
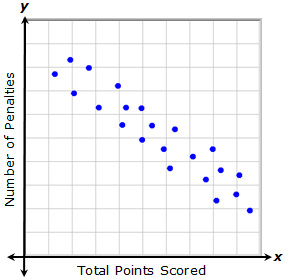
A relationship with a negative linear association is one in which as one variable increases, the other variable decreases at an almost constant rate.
In this example, each point represents the total points that a player scored and the number of penalties they received during a recent game. As the number of penalties increases, the total points scored decreases. Likewise, as the total points scored increases, the number of penalties received decreases.
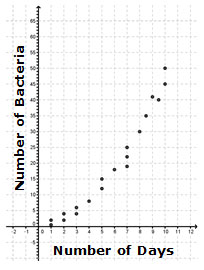
A relationship with a non-linear association is one in which as one variable increases, the other variable changes in a way that is not constant but is predictable.
In this example, as the number of days increases, the number of bacteria in a Petri dish increases. However, the number of bacteria does not increase at a constant rate, as it would for a positive linear association. Instead, the data appear to follow a curve, which is a non-linear relationship.
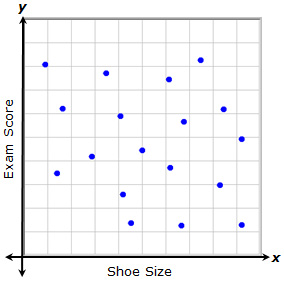
Sometimes, a relationship shows no trend. In this case, there is no detectable pattern in the data that allows you to say that as one variable changes, the second variable changes in a particular way. In this example, each point represents a student's shoe size and his or her recent social studies exam score. There does not appear to be a relationship between the shoe size and the exam score.