Rate of change may be represented in various forms. The Williams family is taking a road trip to visit relatives for the holidays. Mrs. Williams drives at an average speed of 60 miles per hour. If Mrs. Williams has been driving for x hours, what is the number of miles, y, that the Williams family has traveled?
Let’s represent this situation using a table, algebraic representation, and a graph.
 Move your mouse over the interactive to see the different representations of this situation.
In each representation, what similarities do you see in the changes in distance and changes in time?
Interactive popup. Assistance may be required. In the verbal, table, graph, and algebraic representations the change in distance for 1 hour is 60 miles.
The table below shows the distance and time for the Pennington's family road trip. Use the table to answer questions 1 – 3.
Pennington Family Road Trip |
||||
| Time (hours) | 2 |
4 |
6 |
8 |
| Distance (miles) | 170 |
340 |
510 |
680 |
Interactive popup. Assistance may be required.
Determine the ratio of the change in the dependent variable (distance) to the change in the independent variable (time).
Rate of Change = change in y over change in x
Change in y
Change in x
= 340 miles – 170 miles over 4 hours – 2 hours
340 miles – 170 miles
4 hours – 2 hours
= 170 miles over 2 hours
170 miles
2 hours
= 85 miles per hour
Interactive popup. Assistance may be required.
Write a sentence relating the distance traveled to each hour driven.
Interactive popup. Assistance may be required.
For each hour traveled, the distance increases by 85 miles.
Click on the graph below to plot the points from the table.
Interactive popup. Assistance may be required.
Which of the two numbers is greater?
Interactive popup. Assistance may be required.
Interactive popup. Assistance may be required.
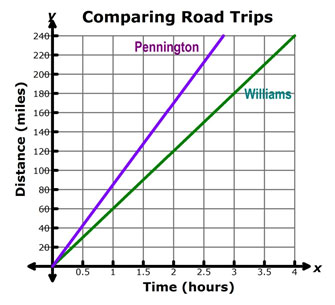
Graph both relationships on the same set of axes, and compare the two lines.
Interactive popup. Assistance may be required.
The graph of the data for the Pennington family road trip is steeper than the graph of the data for the Williams family road trip.