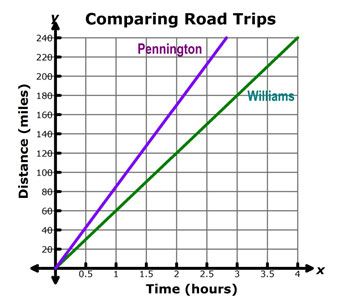
In the previous section, you compared graphs of two different families’ road trips. You discovered that the graph of the Pennington family road trip was steeper than the graph of the Williams family road trip because the rate of change for the Pennington family was greater than the rate of change for the Williams family.
Graphically, the rate of change represents the slope of a line. The slope of a line is the steepness of the graph. Therefore,
Rate of Change = change in y over change in x Change in y Change in x = slope
Complete the activity below to learn more about the rate of change as the slope of a line.
 Directions:
Drag and drop each descriptor of rate of change and slope to the correct graph within the table.
Directions:
Drag and drop each descriptor of rate of change and slope to the correct graph within the table.
How can you tell if a line has an increasing slope?
Interactive popup. Assistance may be required. The line will move up and to the right. The y-values increase as the x-values increase.
How can you tell if a line has a decreasing slope?
Interactive popup. Assistance may be required. The line will move down and to the right. The y-values decrease as the x-values increase.
How can you tell if a line has a slope of zero?
Interactive popup. Assistance may be required. The line will be horizontal, since the y-values do not change as the x-values increase.
How can you tell if a line has an undefined slope?
Interactive popup. Assistance may be required. The line will be vertical, since all y-values are possible for the given x-value.