Use the interactive below to practice plotting ordered pairs of rational numbers. For each of the given points, drag the point to the location indicated by the coordinates next to the point.
In this section, you will review graphing ordered pairs of points that represent data from a proportional relationship.
Graphing ordered pairs on a coordinate plane is an important way to visually represent the relationship between the two variables in a set of data.
To practice graphing ordered pairs of data, consider the situation below.
Melanie works as a courier. She made a chart of the distances that she drove one day and the time that it took her to drive each distance.
Distance (miles) |
Time (hours) |
20 |
0.5 |
40 |
1 |
45 |
1.125 |
50 |
1.25 |
30 |
0.75 |
10 |
0.25 |
Use the interactive below to practice plotting ordered pairs of rational numbers. For each of the given points, drag the point to the location indicated by the coordinates next to the point.
Use the graph to answer the questions below.
Interactive popup. Assistance may be required.
The points all appear to lie on the line.
Interactive popup. Assistance may be required.
Yes. (0, 0) represents Melanie driving 0 miles in 0 hours.
Interactive popup. Assistance may be required.
40 miles
Interactive popup. Assistance may be required.
40 miles per hour, or 40 miles over 1 hour 40 miles 1 hour
How can you identify the unit rate from the graph of a proportional situation?
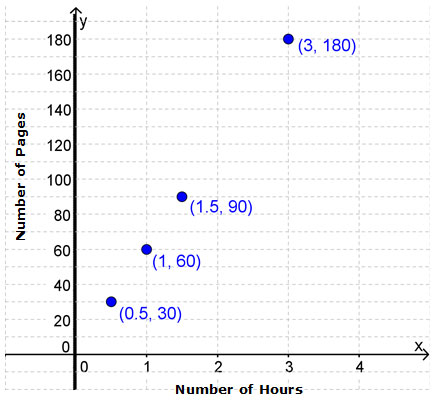
| Number of Hours, x | 0.5 |
1 |
1.5 |
3 |
| Number of pages, y | 30 |
60 |
90 |
180 |
Interactive popup. Assistance may be required.
How many pages can Rachel read in 1 hour?