In the last section, you practiced plotting points that represent data for a proportional situation. In this section, you will use graphs of data from proportional situations in order to compare the unit rate from the data with the slope of the line.
Armando has plotted 3 points, E, F, and G, that represent values from a proportional relationship. He connected the points with line EO, connecting point E with the origin.
 Click and drag the orange point to investigate how the unit rate for the data represented by the points Armando plotted compares to the slope of the line. Use the interactive to answer the questions that follow.
Unit Rate and SlopeCompare the slope of the line with the unit rate created by Point E and the origin.
OnTRACK for College Readiness, Created with GeoGebra |
Interactive popup. Assistance may be required.
One way to calculate the unit rate is to divide the y-values by the x-values. Since the situation is proportional, these values should all be the same.
Interactive popup. Assistance may be required.
The unit rate of the data is the same as the slope of the line.
The slope of a line, m, can be represented as the ratio of a vertical distance to a horizontal distance between two points. The line representing a proportional relationship always contains the origin, (0, 0). If one other point is (1, a), why is the slope the same as the unit rate represented by the origin and the point (1, a)?
For each data set graphed below, identify the slope of the line that best models the data.
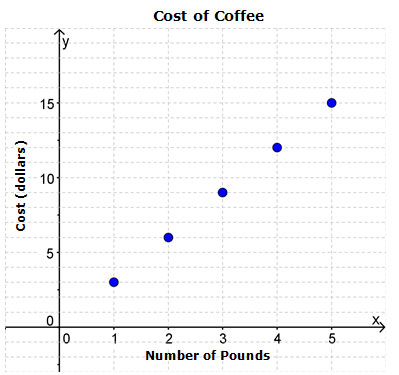
Interactive popup. Assistance may be required.
What is the unit rate of the data represented in the graph?
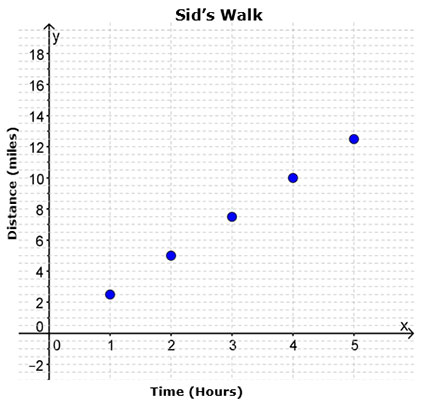
Interactive popup. Assistance may be required.
What is the unit rate of the data represented in the graph?
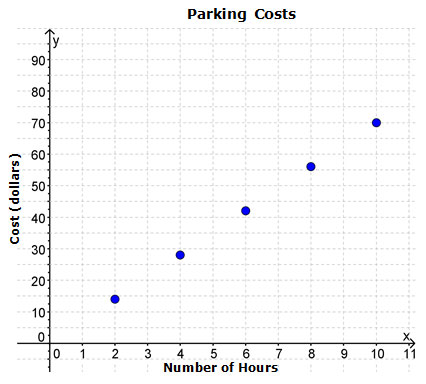
Interactive popup. Assistance may be required.
What is the unit rate of the data represented in the graph?