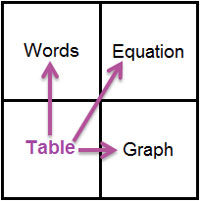
In this section we will look at ways to work with a data table.
Isidro is playing a "guess the rule" game on the computer. He types in a number, and the computer gives a number in response. The program generates the following data set:
| x | y |
| -6 | 8 |
| -3 | 6 |
| 0 | 4 |
| 3 | 2 |
| 6 | 0 |
What is the change in the y-values from one row to the next row?
Interactive popup. Assistance may be required.
The y-values decrease by 2 for each row. 
What is the change in the x-values from one row to the next row?
Interactive popup. Assistance may be required.
The x-values increase by 3 for each row.
What is the ratio of the changes in y-values to the changes in x-values?
Interactive popup. Assistance may be required.
-
-Two over 3
2
3
How does the value of y change as the value of x increases?
Interactive popup. Assistance may be required.
The value of y decreases as the value for x increases.
Does the value of y decrease at a constant rate or at a variable rate?
Interactive popup. Assistance may be required.
How much would the value of y change if the value of x changed by 1?
Interactive popup. Assistance may be required.
The value of y changes by –
Two Thirds
2
3
when the value of x increases by 1.
To calculate the value of y would you multiply the value of x by ( – Two Thirds
2
3
) or add (– Two Thirds
2
3
) to the value of x?
Interactive popup. Assistance may be required.
Multiply by – Two Thirds
2
3
What is the value of y when the value of x is 0?
Interactive popup. Assistance may be required.
The value of y is 4 when the value of x is 0.
Use the answer to the previous question to write a new sentence that describes how the value of y relates to the value of x.
Interactive popup. Assistance may be required.
The value of y is 4 more than (–
Two Thirds
2
3
)
times the value of x.
Write your sentence as a mathematical equation.
Interactive popup. Assistance may be required.
y = –
Two Thirds
2
3
x + 4
Click here if you need a review of plotting points on an axis.
Click here to open a printable sheet of coordinate planes you can use to make draw graphs.
Graph the data from the table on one of the coordinate planes on the sheet you just printed.
| x | y |
| -6 | 8 |
| -3 | 6 |
| 0 | 4 |
| 3 | 2 |
| 6 | 0 |

 If you need help graphing the points from the table above, you can use this
plotting applet.
If you need help graphing the points from the table above, you can use this
plotting applet.
ClickInteractive popup. Assistance may be required. for applet instructions.
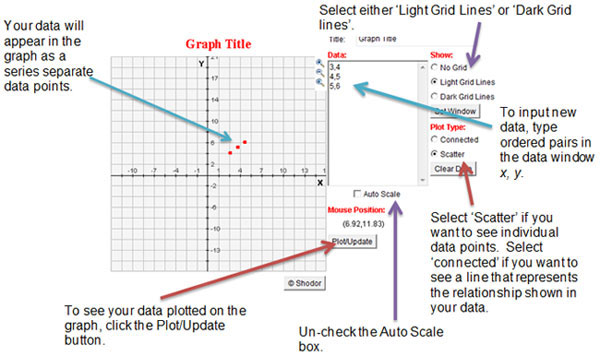
Source: Simple Plot, Shodor
As you enter data, click the Plot/Update button after each ordered pair to see the data point appear on the graph.
ClickInteractive popup. Assistance may be required. to see the completed graph.
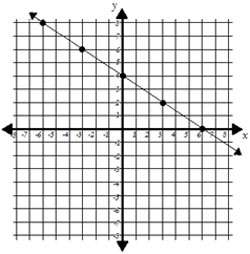
If you are drawing a graph to show only the data in the table, you plot individual points on the graph. If you are drawing a graph to represent the relationship between x and y that is shown by your data, then you connect the points with a line that continues on in either direction.
Write a verbal description and an equation, and draw a graph that each represent the relationship shown in the following data tables: