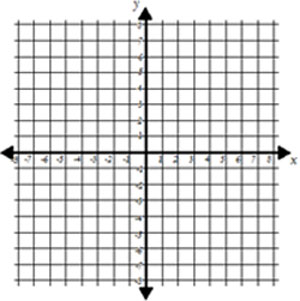
When graphing data, we use two intersecting number lines called axes. Together these axes create what we call the coordinate plane.

Which variable represents the horizontal (left-right) axis?
Interactive popup. Assistance may be required.
The horizontal axis is represented by the x.

Which variable represents the vertical (up-down) axis?
Interactive popup. Assistance may be required.
The vertical axis is represented by y.

How would you graph the point x = -3 on a single number line?
Interactive popup. Assistance may be required.
Place a dot on the number line at -3.

How would you plot the point y = 2 on a single number line?
Interactive popup. Assistance may be required.
Place a dot on the number line at 2.

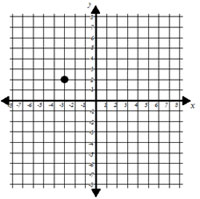
If each axis represents a number line, how would you graph an (x, y) point like (-3, 2)?
Interactive popup. Assistance may be required.

Place a dot on the grid that lines up with -3 to the right and 2 up.
