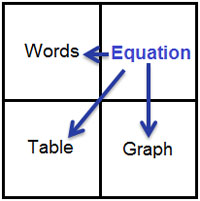
Given an equation, you can generate a graph, fill in values for a table, and write a description.

Sydney finds that the data from her science experiment can be represented by the equation listed below.
y = 3x – 1
Answer the following questions to write a verbal description for the equation.
If you are given a value for x, what two steps do you need to follow to calculate a value for y?
Interactive popup. Assistance may be required.
Step 1: Multiply x by three.
Step 2: Subtract one from that product.

Re-write your answer to the previous question in one complete sentence. (It is often helpful to start with the phrase, "The value of y is...")
Interactive popup. Assistance may be required.
The value of y is one less than three times the value of x.
Use the following questions to help you fill in the table below.
Calculate the value for y if x = -2
Interactive popup. Assistance may be required.
y = 3(-2) – 1
Interactive popup. Assistance may be required.
y = -7
Calculate the value for y if x = -1
Interactive popup. Assistance may be required.
y = 3(-1) – 1
Interactive popup. Assistance may be required.
y = -4
Calculate the value for y if x = 0
Interactive popup. Assistance may be required.
y = 3(0) – 1
Interactive popup. Assistance may be required.
y = -1
Calculate the value for y if x = 1
Interactive popup. Assistance may be required.
y = 3(1) – 1
Interactive popup. Assistance may be required.
y = 2
Calculate the value for y if x = 2
Interactive popup. Assistance may be required.
y = 3(2) – 1
Interactive popup. Assistance may be required.
y = 5
Copy the following table into your notes and, based on your answers to the previous questions, fill in the missing values.
| x | process | y |
| -2 | ||
| -1 | ||
| 0 | ||
| 1 | ||
| 2 |
| x | process | y |
| -2 | y = 3(-2) – 1 | -7 |
| -1 | y = 3(-1) – 1 | -4 |
| 0 | y = 3(0) – 1 | -1 |
| 1 | y = 3(1) – 1 | 2 |
| 2 | y = 3(2) – 1 | 5 |
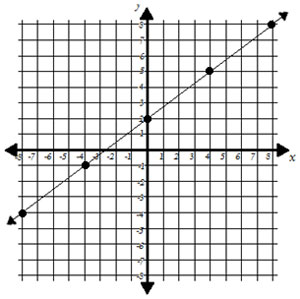
Now that you have a table of values, use what you learned in section 3 to draw a graph of the relationship.
Interactive popup. Assistance may be required.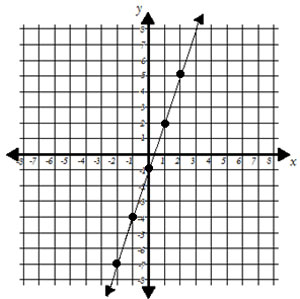
Create a verbal description, a table, and a graph to represent the relationship shown in the following equation.
Interactive popup. Assistance may be required.
Verbal description:| x | y |
| -8 | -4 |
| -4 | -1 |
| 0 | 2 |
| 4 | 5 |
| 8 | 8 |